The function produces a waterfall plot based on the z-values from the interventions that differ by one specific component combination.
Arguments
- model
An object of class
netmeta.- sep
A single character that defines the separator between interventions components.
- combination
A single character that specifies the component combination of interest.
- z_value
logical. IfTRUEz-values are used instead of interventions effects.- random
logical. IfTRUEz-values are obtained from the random-effects NMA model instead of the fixed-effect NMA model.
Details
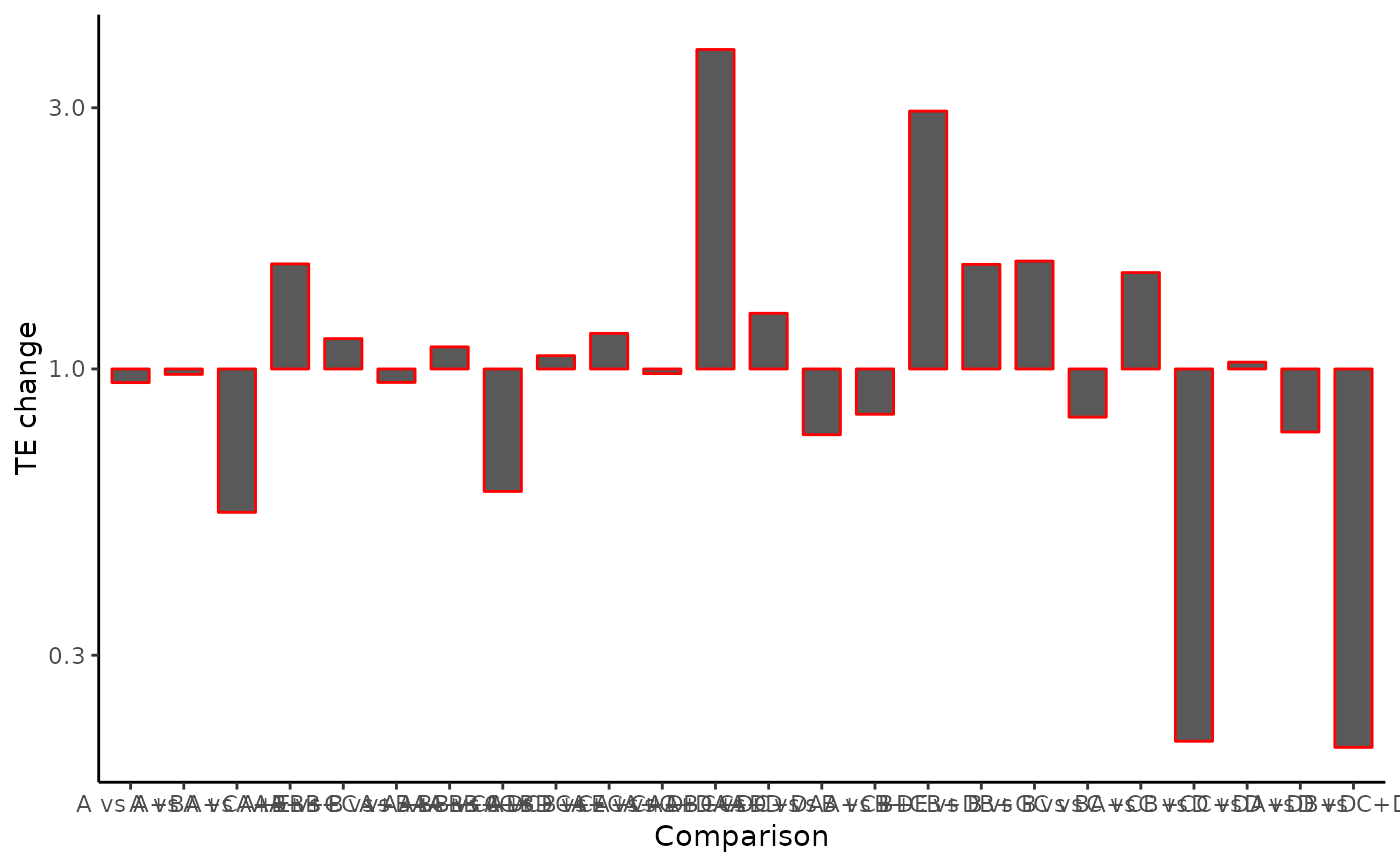
The function based on the intervention's z-values (default choice) obtained from the network meta-analysis (NMA) model visualizes all the observed interventions that differ by one specific component combination, in order to explore if the one extra component combination from every comparison has a positive or negative impact. Bars above or below of the \(y = 0\) line, indicates that the inclusion of the extra specific component combination has an impact on the intervention. The direction of the impact (positive or negative), depends on the outcomes’ nature (beneficial or harmful).
The combination of interest is defined from the argument combination. By default the
function visualizes the interventions that differ by one component (combination = NULL).
If for example combination = "A+B", the function plots the interventions that differ
by "A+B".
Note
In the case of dichotomous outcomes, the log-scale is used in axis y. Also, the function can be applied only in network meta-analysis models that contain multi-component interventions.
Examples
data(nmaMACE)
watercomp(nmaMACE)