The function based on the network meta-analysis (NMA) estimates produces violin plots from interventions that include the component combinations of interest.
Usage
specc(
  model,
  sep = "+",
  combination = NULL,
  components_number = FALSE,
  groups = NULL,
  random = TRUE,
  z_value = FALSE,
  prop_size = TRUE,
  fill_violin = "lightblue",
  color_violin = "lightblue",
  adj_violin = 1,
  width_violin = 1,
  boxplot = TRUE,
  width_boxplot = 0.5,
  errorbar_type = 5,
  dots = TRUE,
  jitter_shape = 16,
  jitter_position = 0.01,
  values = TRUE
)
Arguments
- model
An object of class
netmeta.- sep
A single character that defines the separator between interventions components.
- combination
A character vector that specifies the component combinations of interest.
- components_number
logical. IfTRUEthe violins are created based on the number of components included in the interventions.- groups
A character vector that contains the clusters of the number of components. Elements of the vector must be integer numbers (e.g. 5 or "5"), or range values (e.g. "3-4" ), or in the "xx+" format (e.g "5+").
- random
logical. IfTRUEthe random-effects NMA model is used instead of the fixed-effect NMA model.- z_value
logical. IfTRUEz-values are used instead of interventions effects.- prop_size
logical. IfTRUEin the case wherez_value == FALSE, the size of the dots is proportional to the precision of the estimates.- fill_violin
fill color of the violin. See
geom_violinfor more details.- color_violin
color of the violin. See
geom_violinfor more details.- adj_violin
adjustment of the violin. See
geom_violinfor more details.- width_violin
width of the violin. See
geom_violinfor more details.- boxplot
logical. IfTRUEboxplots are plotted.- width_boxplot
width of the boxplot. See
geom_boxplotfor more details.- errorbar_type
boxplot's line type. See
stat_boxplotfor more details.- dots
logical. IfTRUEdata points are plotted.- jitter_shape
jitter shape. See
geom_jitterfor more details.- jitter_position
jitter position. See
geom_jitterfor more details.- values
logical. IfTRUEmedian value of each violin is printed.
Details
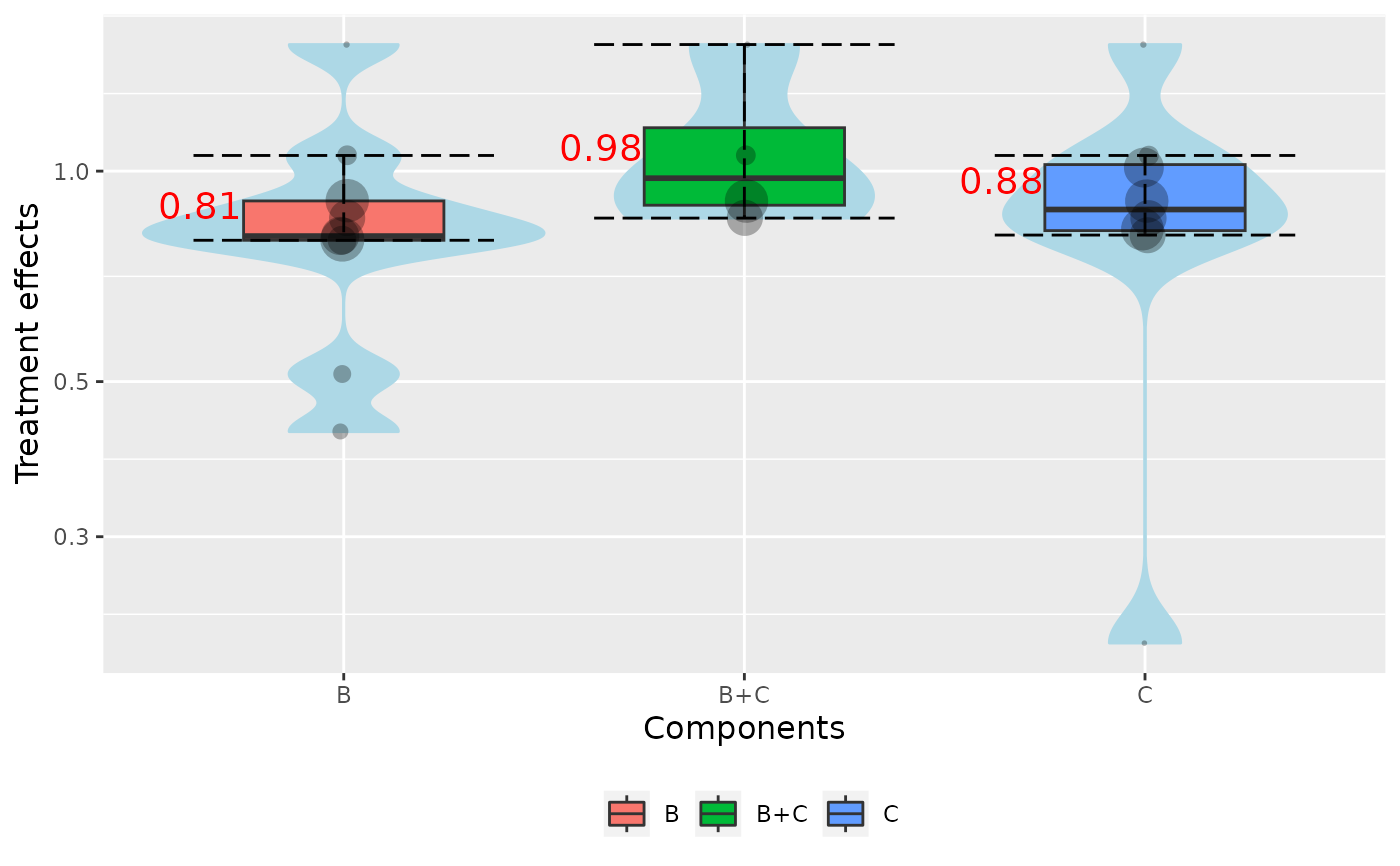
By default the function creates a violin for each component of the network (combination = NULL). Each violin visualizes the
distribution of the effect estimates, obtained from the interventions that include the corresponding component.
Combinations of interest are specified from the argument combination. For example, if combination = c("A", "A + B"),
two violin plots are produced. The first one is based on the interventions that contain the component "A", and the second one, based
on the interventions that contain both components A and B.
By setting the argument components_number = TRUE, the behavior of intervention's effect as the number of components increased
is explored, by producing violins based on the number of components included in the interventions. If the number of
components included in a intervention ranges between 1 and 3, then 3 violins will be produced in total. The violins will be based on
the interventions that include one component, two components, and three components respectively.
The number of components could be also categorized in groups by the argument groups. For
example if components_number = TRUE and groups = c("1-3", 4, "5+"), 3 violins will be created. One for the
interventions that contain less than 3 components, one for the interventions that contain 4 components and one for those
that contain more than 5 components.
The function by default uses the NMA relative effects, but it could be adjusted to use intervention's z-scores by setting z_value = TRUE.
In the case where the NMA relative effects, the size of dots reflects the precision of the estimates. Larger dots indicates
more precise NMA estimates.