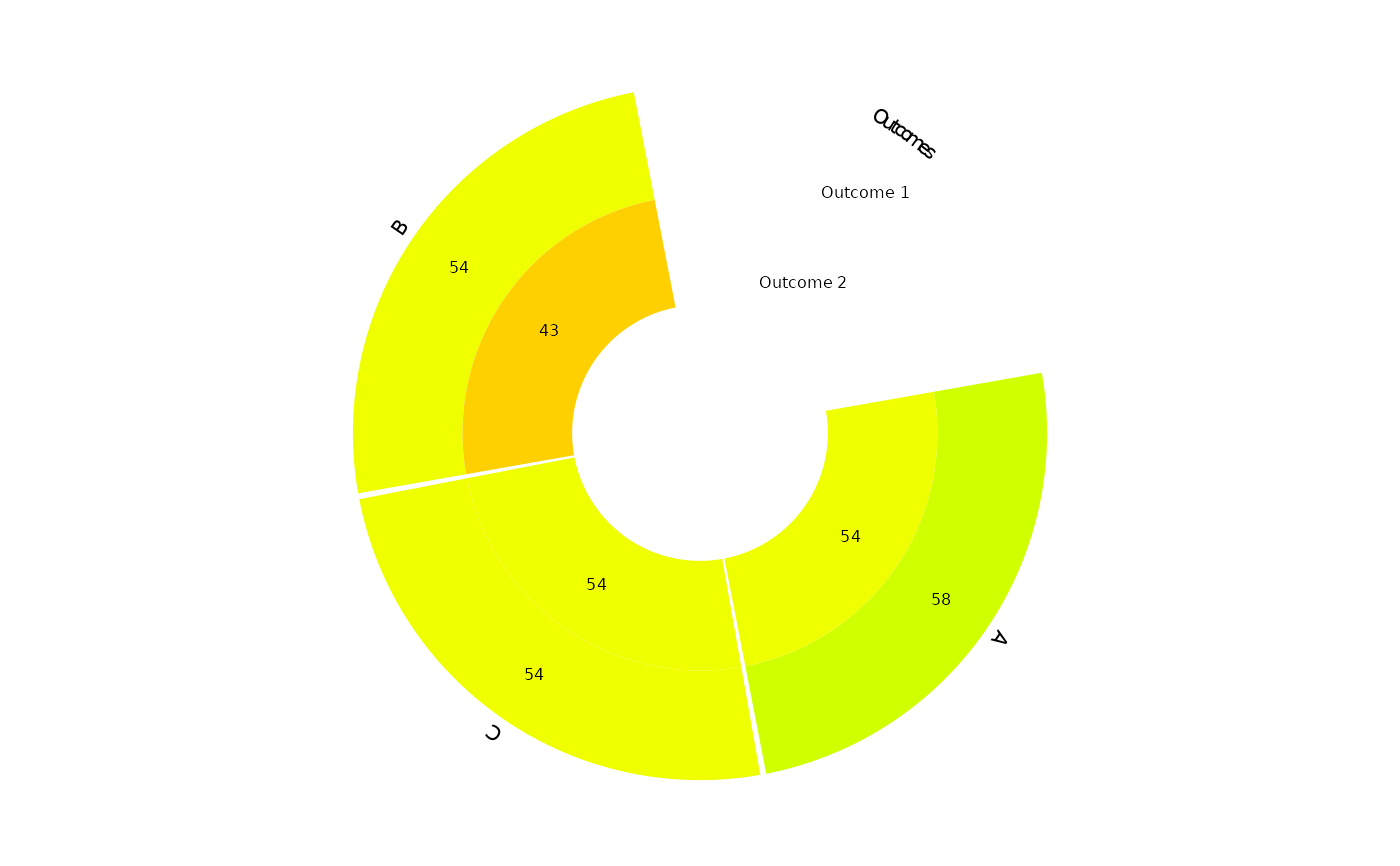
Rank heat plot summarizes the components' p-scores for multiple outcomes.
Usage
rankheatplot(
  model,
  sep = "+",
  median = TRUE,
  random = TRUE,
  outcomeNames = NULL,
  cex_components = NULL,
  cex_values = NULL,
  cex_outcomes = NULL
)
Arguments
- model
A list of
netmetamodels.- sep
A single character that defines the separator between interventions components.
- median
logical. IfTRUEthe median is used as a summary measure instead of the mean.- random
A
logicalvector that specifies the NMA model for each outcome. IfTRUEthe random-effects NMA model is used instead of the fixed-effects NMA model.- outcomeNames
A character vector that specifies the names of the outcomes.
- cex_components
Font size of components' names.
- cex_values
Font size of p-scores.
- cex_outcomes
Font size of outcomes' names.
Details
The function creates a rank heat plot, where the number of circles depend on the number of outcomes.
Each circle is divided by the total number of components, and each sector is colored according
the corresponding component p-score. Components' p-scores are summarized by using either the median (median = TRUE)
or the mean (median = FALSE) of the p-scores obtained from the interventions that include the corresponding component.
The sector's colors reflect the magnitude of the components p-scores. Red color indicates a low p-score (close to zero),
while green color indicates values close to 1. Intervention's p-scores are obtained from the network meta-analysis (NMA) model.
By default the random-effects NMA model is used for each outcome (random = TRUE).
Note
The function can be applied only in network meta-analysis models that contain multi-component interventions.
Examples
# \donttest{
# Artificial data set

t1 <- c("A", "B", "C", "A+B", "A+C", "B+C", "A")
t2 <- c("C", "A", "A+C", "B+C", "A", "B", "B+C")

TE1 <- c(2.12, 3.24, 5.65, -0.60, 0.13, 0.66, 3.28)
TE2 <- c(4.69, 2.67, 2.73, -3.41, 1.79, 2.93, 2.51)

seTE1 <- rep(0.1, 7)
seTE2 <- rep(0.2, 7)

study <- paste0("study_", 1:7)

data1 <- data.frame(
  "TE" = TE1, "seTE" = seTE1, "treat1" = t1, "treat2" = t2, "studlab" = study,
  stringsAsFactors = FALSE
)

data2 <- data.frame(
  "TE" = TE2, "seTE" = seTE2, "treat1" = t1, "treat2" = t2, "studlab" = study,
  stringsAsFactors = FALSE
)

# Network meta-analysis models

net1 <- netmeta::netmeta(
  TE = TE, seTE = seTE, studlab = studlab, treat1 = treat1,
  treat2 = treat2, data = data1, ref = "A"
)

net2 <- netmeta::netmeta(
  TE = TE, seTE = seTE, studlab = studlab, treat1 = treat1,
  treat2 = treat2, data = data2, ref = "A"
)

# Rank heat plot

rankheatplot(model = list(net1, net2))

# }
# }