The function based on the network meta-analysis (NMA) estimates explores if a set of components has a positive or a negative impact on the outcome, by creating a scatter plot based on the set of interventions that differ by a specific set of components.
Usage
loccos(
  model,
  sep = "+",
  combination = NULL,
  random = TRUE,
  z_value = FALSE,
  histogram = TRUE,
  histogram.color = "blue"
)
Arguments
- model
An object of class
netmeta.- sep
A single character that defines the separator between interventions components.
- combination
A single character that specifies the component combination of interest.
- random
logical. IfTRUEthe random-effects NMA model is used instead of the fixed-effect NMA model.- z_value
logical. IfTRUEz-values are used instead of interventions effects.- histogram
logical. IfTRUEhistograms are added to the plot.- histogram.color
A single character that specifies the color of the histogram. See
ggMarginalfor more details.
Value
An object of class ggplot.
Details
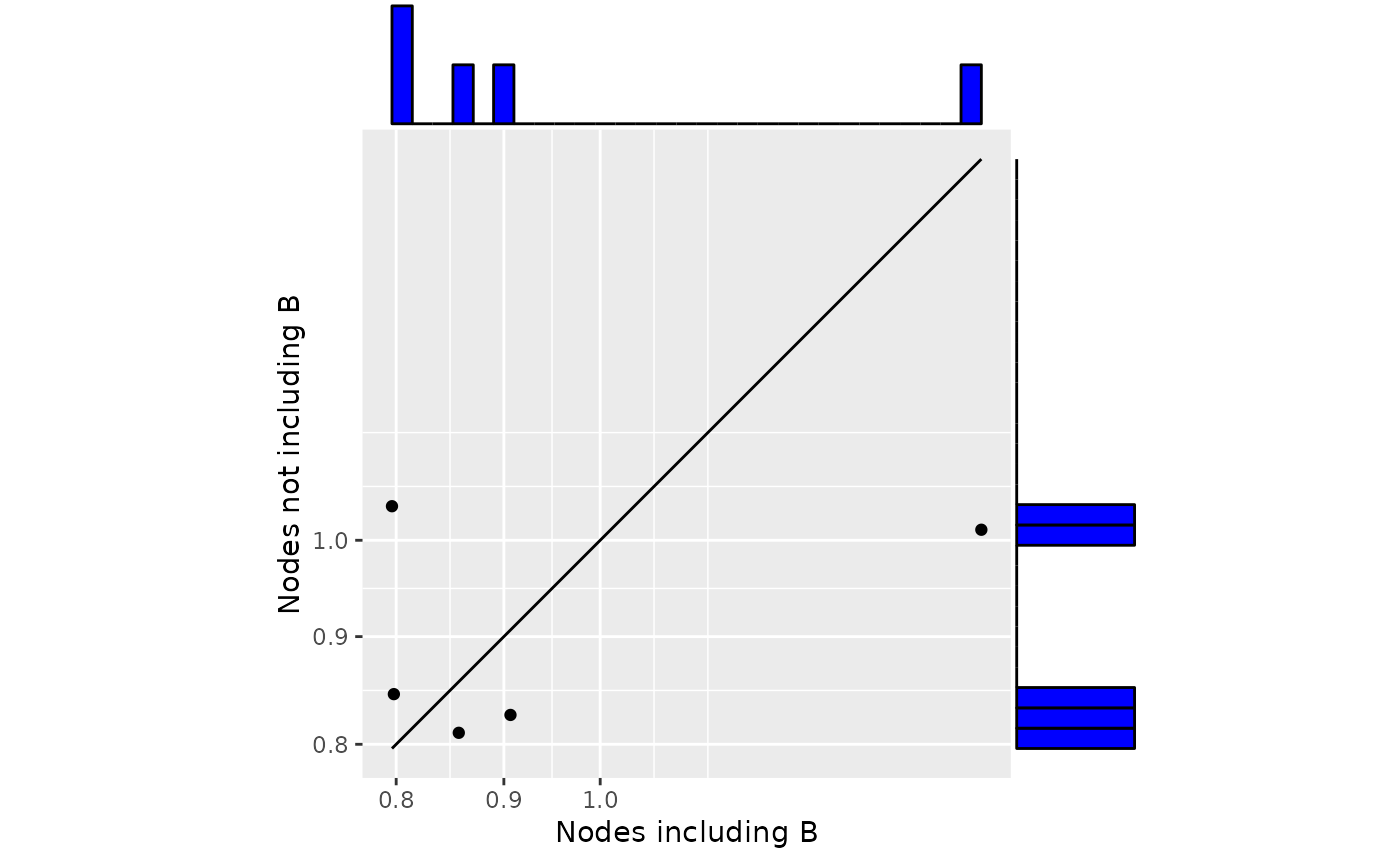
Axis y represents the intervention's effect when the component combination is not included in the intervention, while axis x represents the intervention's effect when is included. Line \(y = x\) splits the plot in two parts. For a beneficial outcome, dots above the line indicates that the inclusion of component combination balk the intervention's efficacy, while dots below the line indicate that the inclusion of the component combination increases intervention's efficacy. The opposite holds for harmful outcomes.
The component combination of interest is specified by the argument combination. For example, if combination = "A", the
function plots all the interventions that differ by the component "A". If combination = NULL, all interventions
that differ by one component are plotted.
The function by default uses the NMA relative effects estimates, but it can be adjusted to use the z-values by setting the argument z_value = TRUE.
Histograms for the nodes that include and not include the component combination can be added to the scatter plot,
by setting the argument histogram = TRUE.