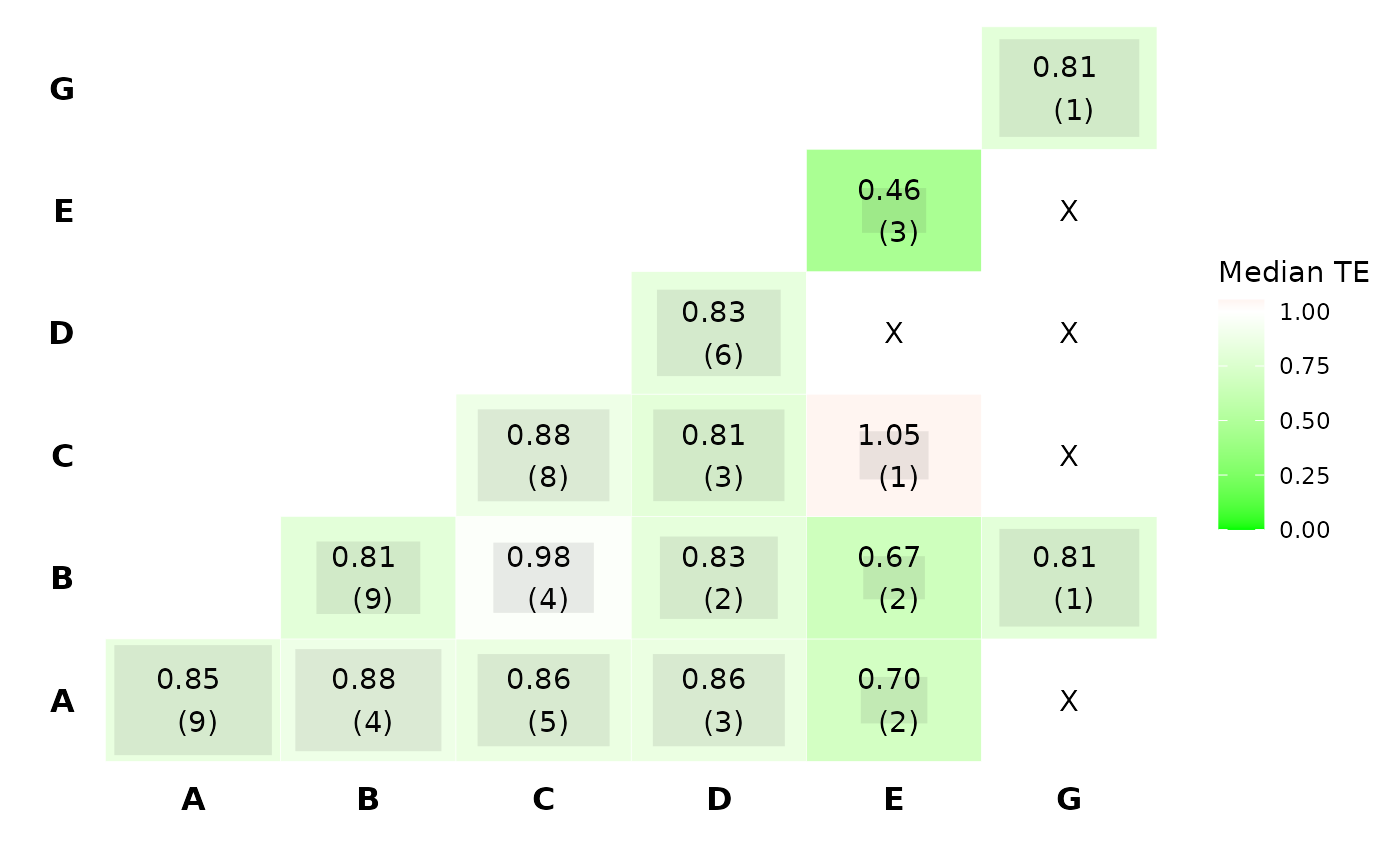
The function creates a heat plot based on the two-by-two component combinations, obtained from the network meta-analysis (NMA) model.
Usage
heatcomp(
  model,
  sep = "+",
  median = TRUE,
  random = TRUE,
  z_value = FALSE,
  freq = TRUE,
  legend_name = NULL
)
Arguments
- model
An object of class
netmeta.- sep
A single character that defines the separator between interventions components.
- median
logical. IfTRUEthe median is used instead of the mean as a summary measure.- random
logical. IfTRUEthe random-effects NMA model is used instead of the fixed-effect NMA model.- z_value
logical. IfTRUEz-values are used instead of interventions effects.- freq
logical. IfTRUEthe frequency of component combinations are printed.- legend_name
A single character that specifies the title of the legend.
Details
Diagonal elements refer to components, while off-diagonal to components' combinations. Each element summarizes by default
the NMA relative effects (z_value = FALSE) of the interventions that includes the corresponding
component combination. Combinations that were not observed in the NMA model, are denoted by the letter "X".
Frequency of component combinations observed in the NMA is printed by default (freq = TRUE). As a summary measure,
the median is used by default (median = TRUE). The magnitude of each relative effect is reflected by the color's intensity.
Estimates close to zero are denoted by white color, and indicates a small magnitude of the corresponding component combination, while
deep green and red colors indicate a large magnitude of the corresponding component combination.
Outcomes nature (beneficial or harmful) is defined in the netmeta model.
The function can be also adjusted to include z-scores by setting the argument z_value = TRUE.
Z-scores quantify the strength of statistical evidence. Thus, dark green (or red) indicates strong statistical evidence that
the corresponding component (or combination of components) performs better (or worse) than the reference intervention.
Note
In the case where the NMA relative effects are used, the uncertainty of the NMA estimates are reflected by the size of the grey boxes. The bigger the box, the more precise the estimate.
By setting median = FALSE, the mean is used instead of the median as a summary measure.
The function can be applied only in network meta-analysis models that contain multi-component interventions.
Examples
data(nmaMACE)
heatcomp(model = nmaMACE)