The function creates density plots in order to explore the efficacy of the components.
Arguments
- model
An object of class
netmeta.- sep
A single character that defines the separator between interventions components.
- combination
A character vector that contains the component combinations of interest.
- violin
logical. IfTRUEthe density is visualized via violins instead of density plots.- random
logical. IfTRUEthe random-effects NMA model is used, instead of the fixed-effect NMA model.- z_value
logical. IfTRUEz-values are used, instead intervention effects.
Details
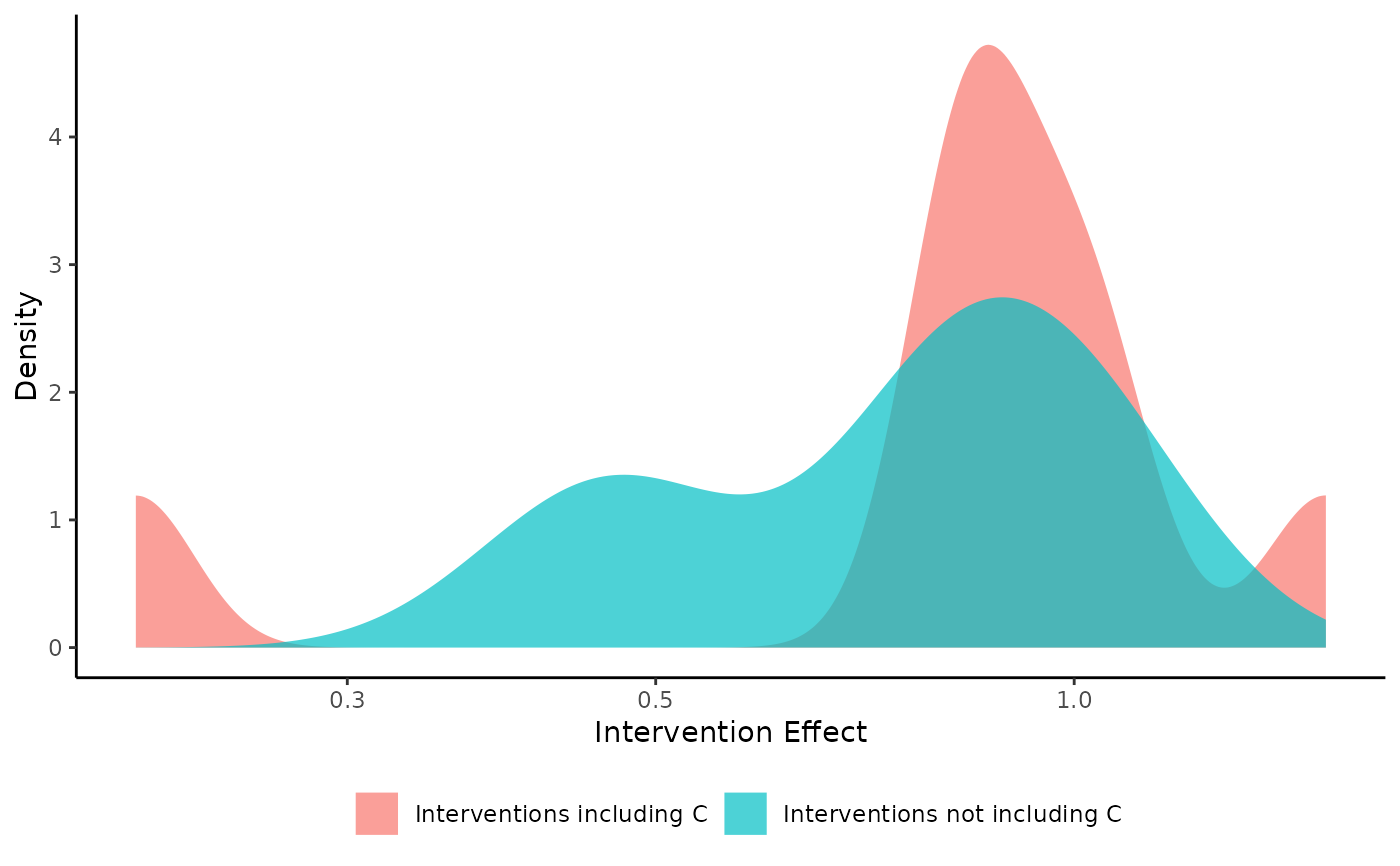
If the length of the argument combination is 1, the function creates two density plots. The first is produced based on the
interventions that include the component combination of interest (which is specified by the argument combination),
while the second on the interventions that do not include the underlying component combination.
If the argument combination includes more than one elements, the number of densities is equal with the length of
the argument combination, and each density is based on the interventions that include the relative component combination.
For example, if combination = c("A + B", "B + C", "A") the function will produce 3 density plots that are based on
the interventions that includes components "A" and "B", the interventions that include components "B" and "C" and
interventions that includes component "A", respectively.
The function by default uses the intervention's relative effects (z_value = FALSE) obtained from the random-effects network
meta-analysis (NMA) model (random = TRUE). It can be also adjusted to use the intervention's z-values
instead of the relative effects, by setting z_value = TRUE.
Note
The efficacy of the components could be explored via violins plots instead of density plots, by setting violin = TRUE.
Also, in the case of dichotomous outcomes, the log-scale is used.
The function can be applied only in network meta-analysis models that contain multi-component interventions.
Examples
data(nmaMACE)
denscomp(model = nmaMACE, combination = "C")