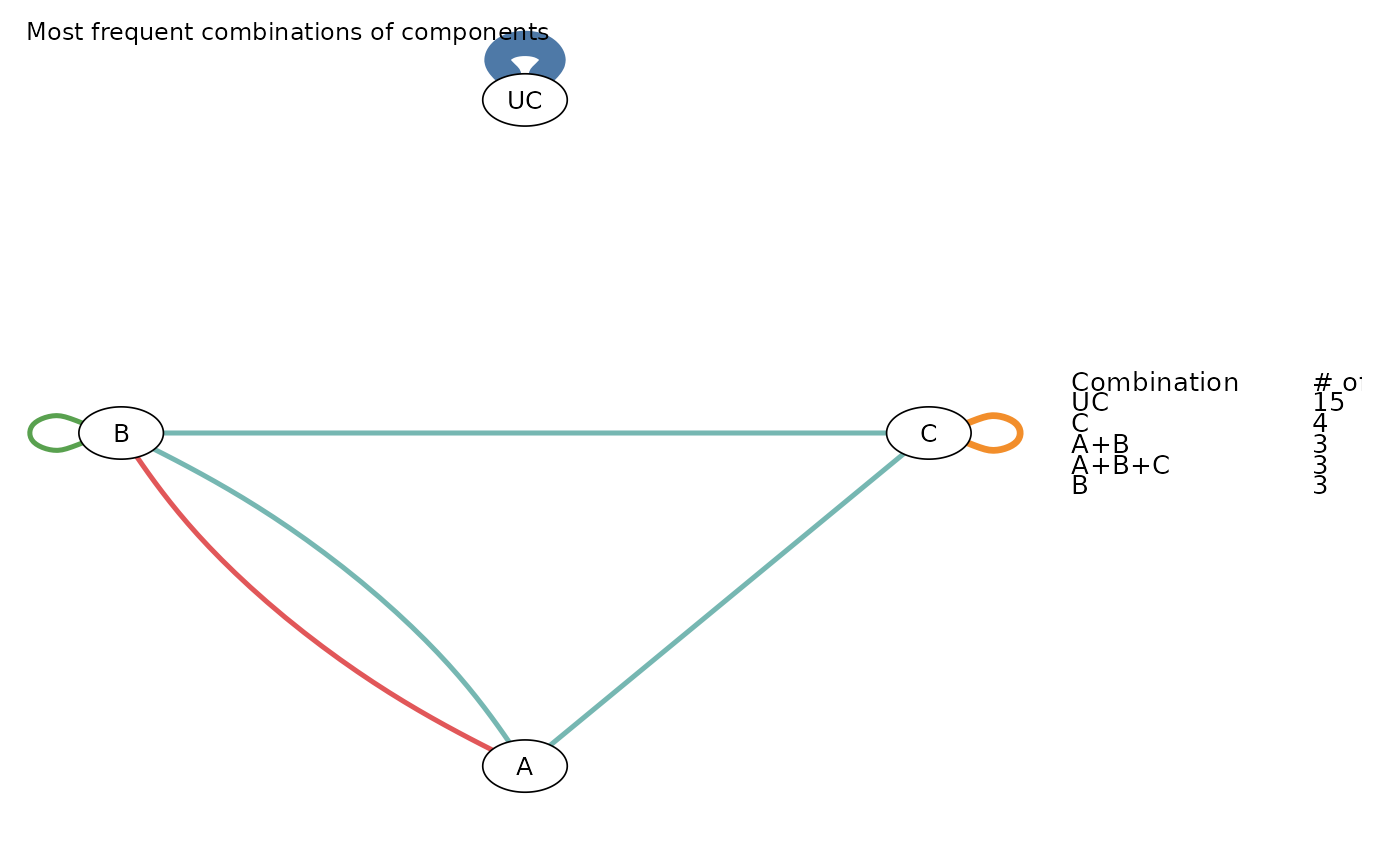
The Components Network Graph is meant to visualize the frequency of components’ combinations found in the network.
Usage
compGraph(
  model,
  sep = "+",
  mostF = 5,
  excl = NULL,
  title = "Most frequent combinations of components",
  print_legend = TRUE,
  size_legend = 0.825
)
Arguments
- model
An object of class
netmeta.- sep
A single character that defines the separator between interventions components.
- mostF
Number of most frequent combinations of the network.
- excl
A character vector that specifies the combinations to be excluded from the plot.
- title
A single character that specifies the overall title of the plot.
- print_legend
logical. IfTRUEthe legend is printed.- size_legend
size of the legend.
Value
Returns (invisibly) a qgraph object.
Details
The function resembles a network plot where nodes represent the individual components found in the network
and edges represent the combination of components found in at least one treatment arm of the trials included in the
network meta-analysis model. Each edge’s color represents one of the unique interventions (components’ combination)
found in the network of interventions. Edges’ thickness indicates the frequency by which each intervention
(combination of components) was observed in the network (number of arms in which the combination was assigned).
The number of the most frequent combinations can be modified from the argument mostF. The function by
default plots the five most frequent components' combinations found in the network.
Note
The function can be applied only in network meta-analysis models that contain multi-component interventions.
Examples
data(nmaMACE)
compGraph(model = nmaMACE)